前言
在前一篇文章中,最后能看到的只是Prometheus自带的一些监控指标,本篇就讲一下如何添加自己的监控信息。
增加配置类
package com.example.demo.config;

import io.micrometer.core.instrument.MeterRegistry;
import org.springframework.boot.actuate.autoconfigure.metrics.MeterRegistryCustomizer;
import org.springframework.context.annotation.Bean;
import org.springframework.context.annotation.Configuration;

@Configuration
public class MetricsConfig {
  @Bean
  public MeterRegistryCustomizer<MeterRegistry> commonTags() {
    return r -> {
      r.config().commonTags("application", "com.example.demo.config");
    };
  }
}
|
Counter
Counter是一种只加不减的计数器
java代码
测试代码
@RestController
public class TestPrometheusController {
  static final Counter counter = Metrics.counter("getUserInfoCount", "user", "info");

  @RequestMapping(value = "/user/info", method = RequestMethod.GET)
  public String getInfo() {
    counter.increment(1D);
    return "success";
  }
}
|
程序起来后,打开http://localhost:8080/actuator/prometheus可以看到
getUserInfoCount_total{application="com.example.demo.config",user="info",} 0.0
|
这里就可以看到添加项的名称 类型 数量值等信息。
浏览器刷新几次http://localhost:8080/user/info后可以观察到这个数量的变化
增加监控项
此时如果在打开http://localhost:9090页面,则可以看到多了getUserInfoCount_total监控这一项
打开http://localhost:3000 grafana页面,新增表盘时监控项选择“getUserInfoCount_total”即可
Gauge
Gauge是一个表示单个数值的度量,它可以表示任意地上下移动的数值测量
AtomicInteger atomicInteger = Metrics.gauge("getUserCacheCount", new AtomicInteger(0));
@RequestMapping(value = "/user/cache/add", method = RequestMethod.GET)
public String addCache() {
atomicInteger.addAndGet(1);
return "success";
}
@RequestMapping(value = "/user/cache/remove", method = RequestMethod.GET)
public String removeCache() {
atomicInteger.decrementAndGet();
return "success";
}
|
启动后,反复调用几次http://localhost:8080/user/cache/add和http://localhost:8080/user/cache/remove,然后参照上面的在grafana添加表盘即可
Timer
Timer(计时器)同时测量一个特定的代码逻辑块的调用(执行)速度和它的时间分布
java代码
Timer timer = Metrics.timer("getUserInfoList", "user", "list");
@RequestMapping(value = "/user/list", method = RequestMethod.GET)
public String getList() {
long start = System.currentTimeMillis();
try {
TimeUnit.MILLISECONDS.sleep(new Random().nextInt(100) + 100);
}catch (InterruptedException e) {
e.printStackTrace();
} finally {
long end = System.currentTimeMillis();
long duration = end - start;
timer.record(duration, TimeUnit.MILLISECONDS);
}
return "success";
}
|
启动后,反复调用几次http://localhost:8080/user/list
增加监控项
添加Timer后,主要是增加了
getUserInfoList_seconds_count{application="com.example.demo.config",user="list",} 12.0
getUserInfoList_seconds_sum{application="com.example.demo.config",user="list",} 1.828
|
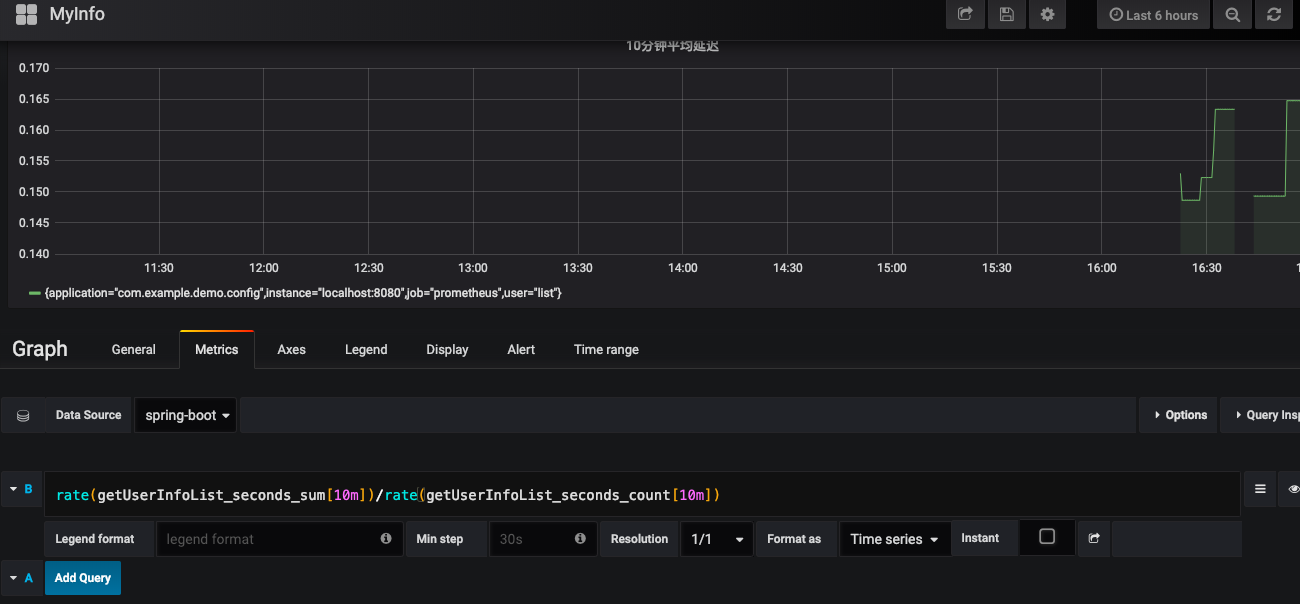
在grafana添加仪表选择需要监控的指标时,需要特别配置。前面都是直接添加了已有项,现在要加一些函数操作
平均延时
这样就是平均延时了
吞吐量则是
rate(getUserInfoList_seconds_count[10s])
|
此处填写时会有模糊匹配函数支持,很方便