前言
总体框架图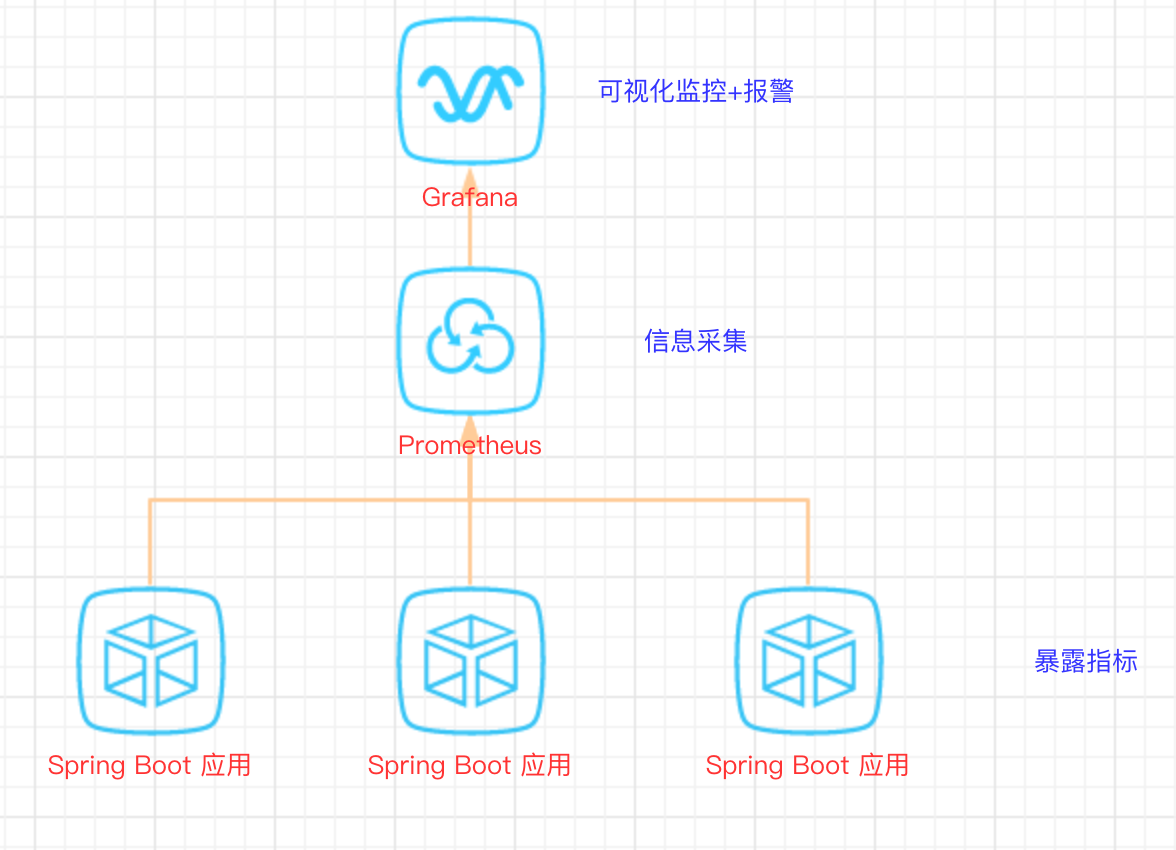
prometheus
简介
Prometheus,是一个开源的系统监控和告警的工具包,其采用Pull方式采集时间序列的度量数据(也支持push方式),通过Http协议传输。它的工作方式是被监控的服务需要公开一个Prometheus端点,这端点是一个HTTP接口,该接口公开了度量的列表和当前的值,然后Prometheus应用从此接口定时拉取数据,一般可以存放在时序数据库中,然后通过可视化的Dashboard(e.g.Grafana)进行数据展示。
支持的prometheus metrics
Counter,Gauge,Histogram,Summary等等。需要注意的是counter只能增不能减,适用于服务请求量,用户访问数等统计,但是如果需要统计有增有减的指标需要用Gauge。
exporter
支持的exporter很多,可以方便的监控很多应用,同时也可以自定义开发非官方提供的exporter。
grafana
简介
grafana,是一个开源的dashboard展示工具,可以支持很多主流数据源,包括时序性的和非时序性的。其提供的展示配置以及可扩展性能满足绝大部分时间序列数据展示需求,是一个比较优秀的工具。
支持的数据源
prometheus,inflexdb,elasticsearch,mysql,postgreSQL,openTSDB等,更多数据源
SpringBoot暴露指标
添加依赖
在pom.xml增加以下依赖
<dependency> |
配置信息
在application.yml增加以下配置项
##prometheusj |
启动SpringBoot应用
启动应用后,打开 http://localhost:8080/actuator/prometheus 即可看到暴露的信息
安装Prometheus
官网下载压缩包
官网地址:https://prometheus.io/download/
根据操作系统下载对应的安装包
解压
# tar zxvf prometheus-2.6.0.darwin-amd64.tar.gz |
修改配置文件
# vim prometheus.yml |
修改为以下内容
# my global config |
启动
# ./prometheus |
打开 http://localhost:9090 即可看到页面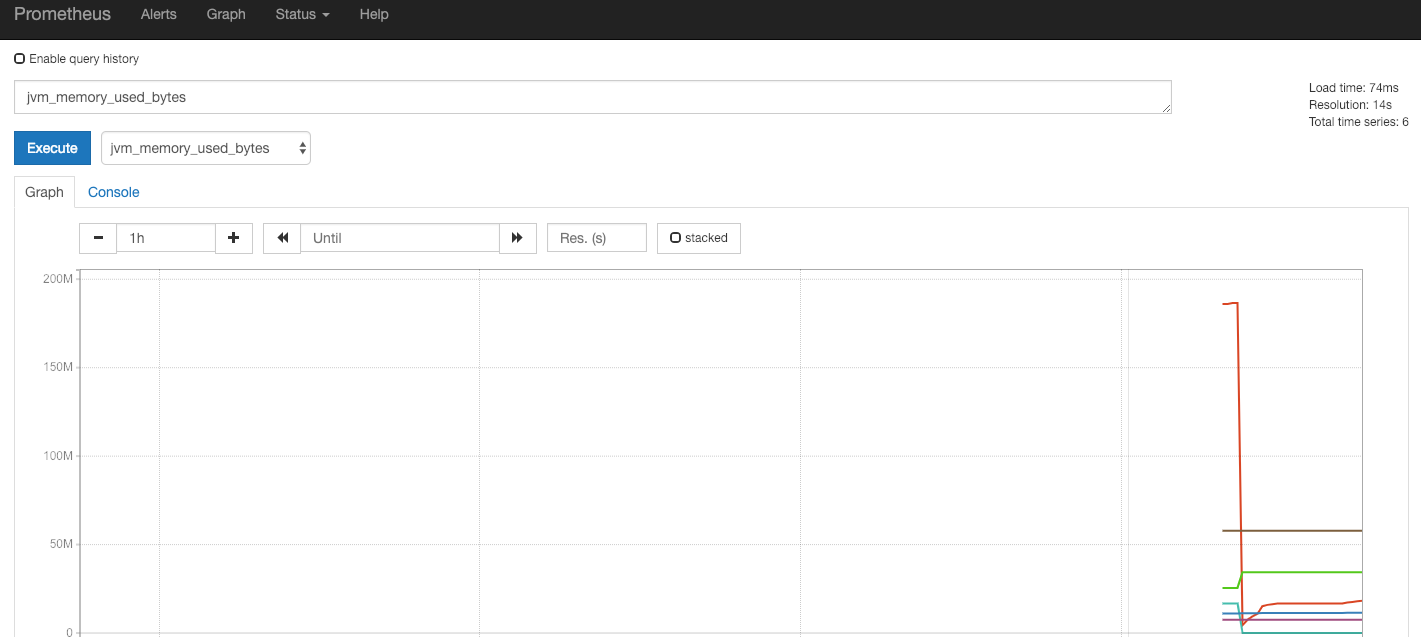
安装Grafana
MAC平台
安装
mac需要提前安装brew
# brew install grafana |
启动
# brew services start grafana |
配置
登陆
打开页面http://localhost:3000/login
登录账号 admin 密码 admin
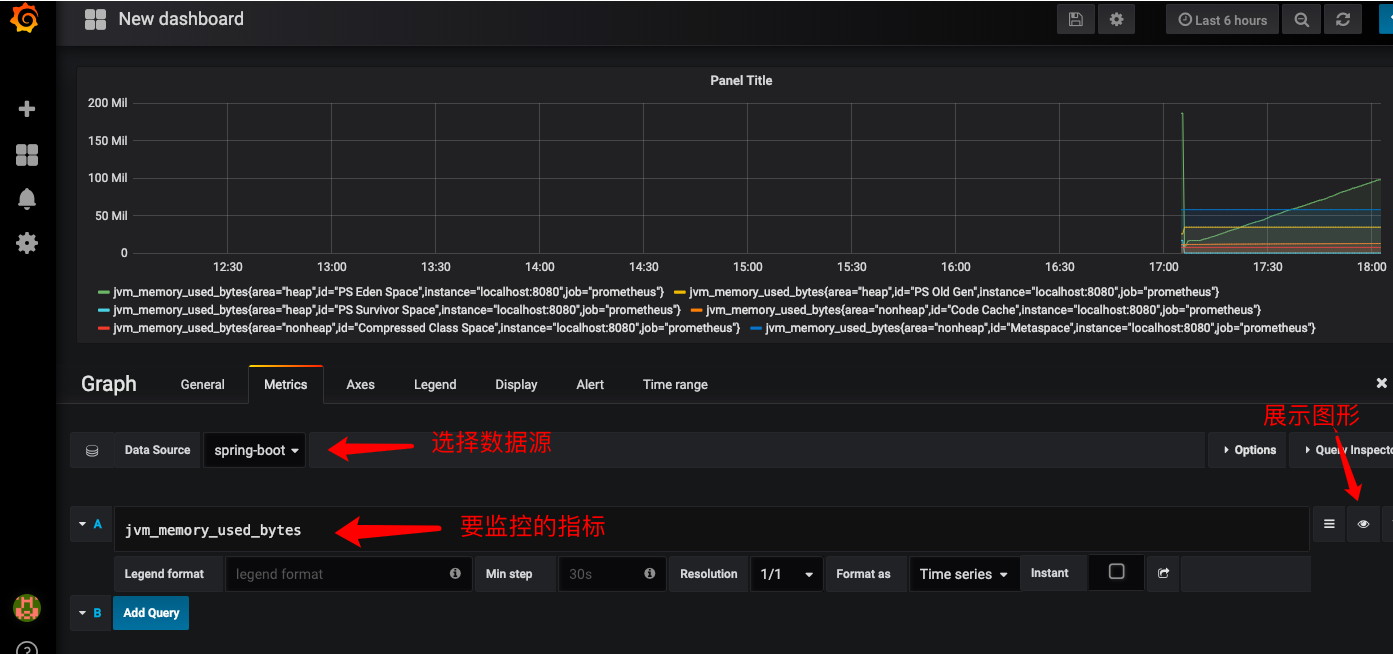
增加数据源
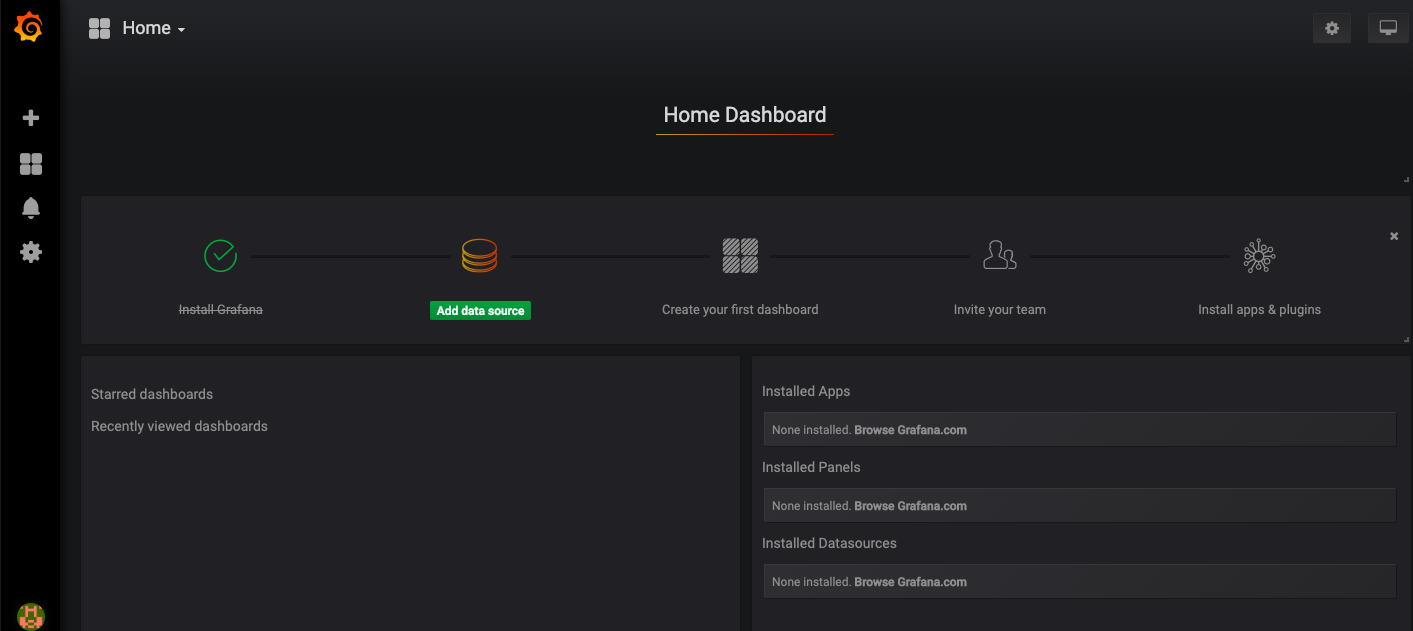
点击“Add data source”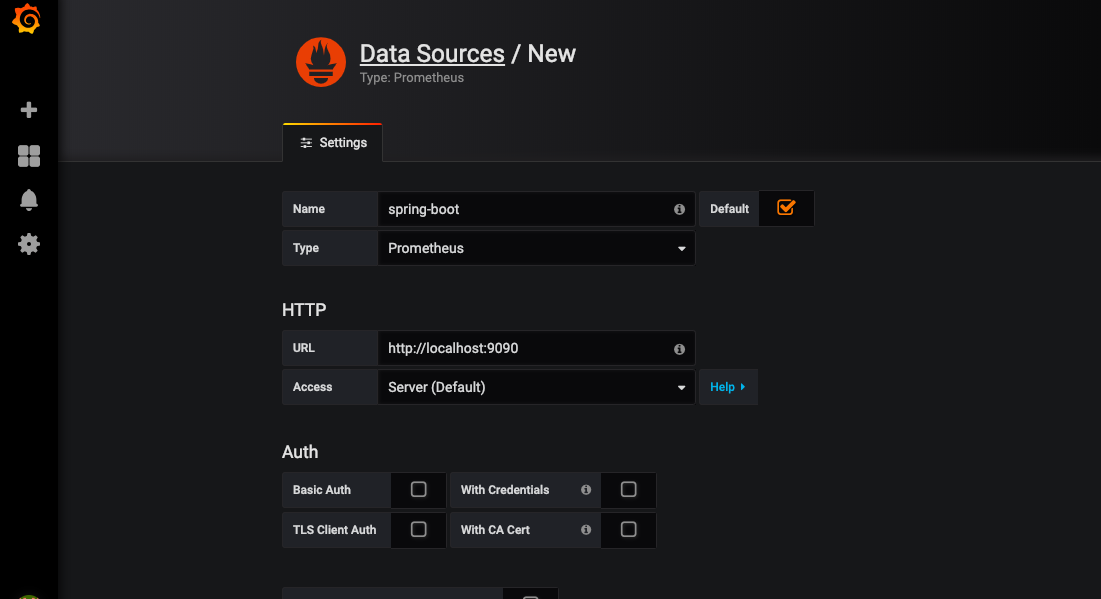
在这里
Type选择Prometheus
URL填上面的Prometheus访问地址
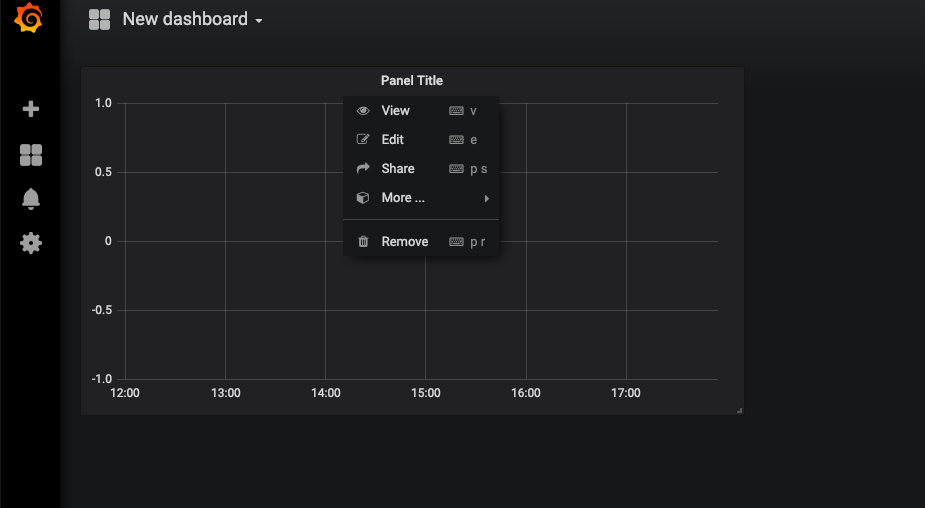
增加图表
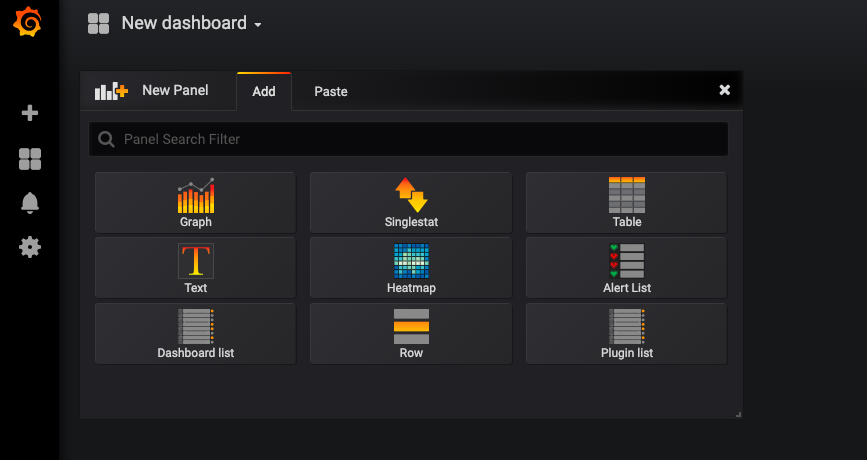
添加一个Graph